|
Elabscience Biotechnology
elisa kit  Elisa Kit, supplied by Elabscience Biotechnology, used in various techniques. Bioz Stars score: 94/100, based on 1 PubMed citations. ZERO BIAS - scores, article reviews, protocol conditions and more https://www.bioz.com/product/neurotrophic+factor+bdnf/Mouse+BDNF+(Brain+Derived+Neurotrophic+Factor)+ELISA+Kit/pm39696694-109-8-11 Average 94 stars, based on 1 article reviews
elisa kit - by Bioz Stars,
2026-11
94/100 stars
|
Buy from Supplier |
|
Cell Signaling Technology Inc
snai1  Snai1, supplied by Cell Signaling Technology Inc, used in various techniques. Bioz Stars score: 93/100, based on 1 PubMed citations. ZERO BIAS - scores, article reviews, protocol conditions and more https://www.bioz.com/product/neurotrophic+factor+bdnf/Human+Brain-Derived+Neurotrophic+Factor/pm26608035-65-47-49 Average 93 stars, based on 1 article reviews
snai1 - by Bioz Stars,
2026-11
93/100 stars
|
Buy from Supplier |
|
ABclonal Biotechnology
bdnf f Bdnf F, supplied by ABclonal Biotechnology, used in various techniques. Bioz Stars score: 92/100, based on 1 PubMed citations. ZERO BIAS - scores, article reviews, protocol conditions and more https://www.bioz.com/product/neurotrophic+factor+bdnf/Human+Brain+Derived+Neurotrophic+Factor+ELISA+Kit/pmc10603561-176-0-3 Average 92 stars, based on 1 article reviews
bdnf f - by Bioz Stars,
2026-11
92/100 stars
|
Buy from Supplier |
|
Boster Bio
bdnf  Bdnf, supplied by Boster Bio, used in various techniques. Bioz Stars score: 93/100, based on 1 PubMed citations. ZERO BIAS - scores, article reviews, protocol conditions and more https://www.bioz.com/product/neurotrophic+factor+bdnf/Rat+BDNF+ELISA+Kit+PicoKine/pmc13633991-112-8-9 Average 93 stars, based on 1 article reviews
bdnf - by Bioz Stars,
2026-11
93/100 stars
|
Buy from Supplier |
|
Alomone Labs
biotinylated bdnf 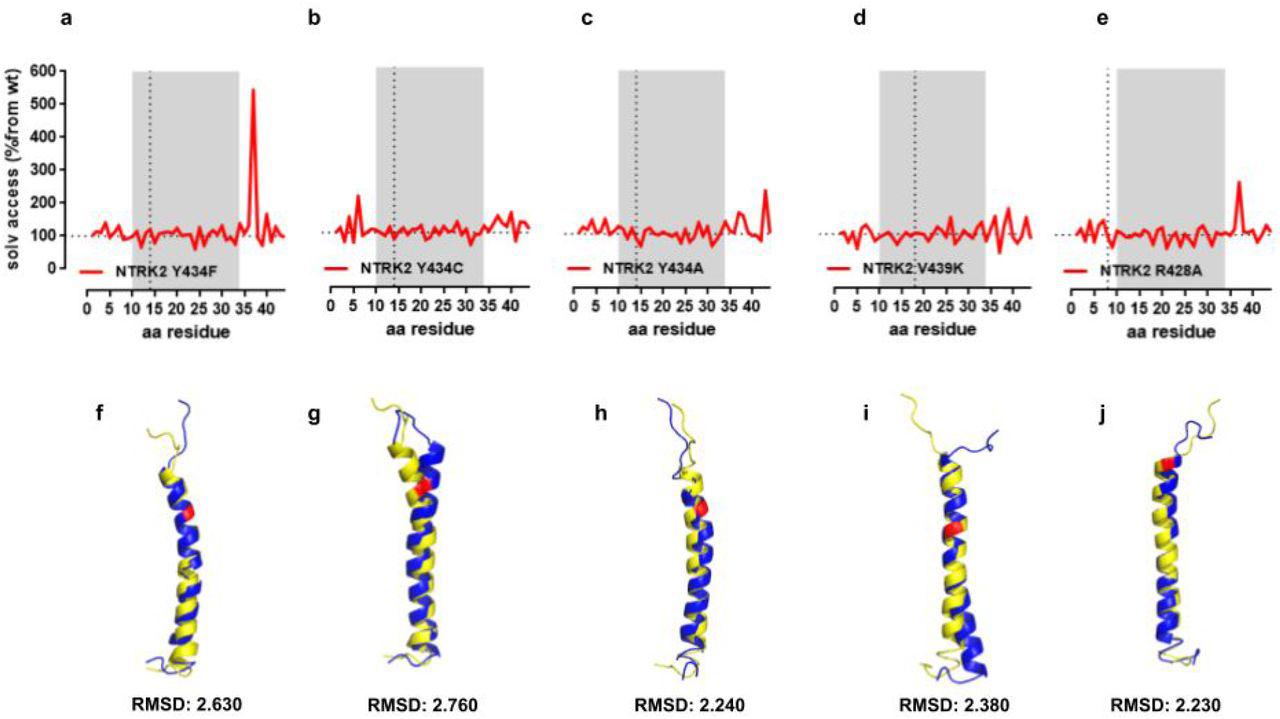 Biotinylated Bdnf, supplied by Alomone Labs, used in various techniques. Bioz Stars score: 94/100, based on 1 PubMed citations. ZERO BIAS - scores, article reviews, protocol conditions and more https://www.bioz.com/product/neurotrophic+factor+bdnf/human+BDNF-Biotin/bio_rxiv__734012-71-12-20 Average 94 stars, based on 1 article reviews
biotinylated bdnf - by Bioz Stars,
2026-11
94/100 stars
|
Buy from Supplier |
|
Alomone Labs
brain derived neurotrophic factor bdnf Brain Derived Neurotrophic Factor Bdnf, supplied by Alomone Labs, used in various techniques. Bioz Stars score: 96/100, based on 1 PubMed citations. ZERO BIAS - scores, article reviews, protocol conditions and more https://www.bioz.com/product/neurotrophic+factor+bdnf/Anti-BDNF+Antibody/pmc12147987-346-50-57 Average 96 stars, based on 1 article reviews
brain derived neurotrophic factor bdnf - by Bioz Stars,
2026-11
96/100 stars
|
Buy from Supplier |
|
Alomone Labs
anti trkb Anti Trkb, supplied by Alomone Labs, used in various techniques. Bioz Stars score: 94/100, based on 1 PubMed citations. ZERO BIAS - scores, article reviews, protocol conditions and more https://www.bioz.com/product/neurotrophic+factor+bdnf/Anti-TrkB+(extracellular)+Antibody/pmc04353718-59-0-2 Average 94 stars, based on 1 article reviews
anti trkb - by Bioz Stars,
2026-11
94/100 stars
|
Buy from Supplier |
|
Alomone Labs
recombinant bdnfpro  Recombinant Bdnfpro, supplied by Alomone Labs, used in various techniques. Bioz Stars score: 90/100, based on 1 PubMed citations. ZERO BIAS - scores, article reviews, protocol conditions and more https://www.bioz.com/product/neurotrophic+factor+bdnf/Recombinant+human+BDNF+proDomain+protein/pm34611268-373-3-7 Average 90 stars, based on 1 article reviews
recombinant bdnfpro - by Bioz Stars,
2026-11
90/100 stars
|
Buy from Supplier |
|
Alomone Labs
b 250  B 250, supplied by Alomone Labs, used in various techniques. Bioz Stars score: 96/100, based on 1 PubMed citations. ZERO BIAS - scores, article reviews, protocol conditions and more https://www.bioz.com/product/neurotrophic+factor+bdnf/Recombinant+human+BDNF+protein/pmc11338522-29-8-5 Average 96 stars, based on 1 article reviews
b 250 - by Bioz Stars,
2026-11
96/100 stars
|
Buy from Supplier |
|
Elabscience Biotechnology
brain derived neurotrophic factor Brain Derived Neurotrophic Factor, supplied by Elabscience Biotechnology, used in various techniques. Bioz Stars score: 95/100, based on 1 PubMed citations. ZERO BIAS - scores, article reviews, protocol conditions and more https://www.bioz.com/product/neurotrophic+factor+bdnf/Rat+BDNF+(Brain+Derived+Neurotrophic+Factor)+ELISA+Kit/pm39820866-86-24-29 Average 95 stars, based on 1 article reviews
brain derived neurotrophic factor - by Bioz Stars,
2026-11
95/100 stars
|
Buy from Supplier |
|
Elabscience Biotechnology
enzymelinked immunosorbent assay kit Enzymelinked Immunosorbent Assay Kit, supplied by Elabscience Biotechnology, used in various techniques. Bioz Stars score: 94/100, based on 1 PubMed citations. ZERO BIAS - scores, article reviews, protocol conditions and more https://www.bioz.com/product/neurotrophic+factor+bdnf/Human+BDNF+(Brain+Derived+Neurotrophic+Factor)+ELISA+Kit/pmc10981270-90-8-12 Average 94 stars, based on 1 article reviews
enzymelinked immunosorbent assay kit - by Bioz Stars,
2026-11
94/100 stars
|
Buy from Supplier |
|
ABclonal Biotechnology
elisa kits Elisa Kits, supplied by ABclonal Biotechnology, used in various techniques. Bioz Stars score: 91/100, based on 1 PubMed citations. ZERO BIAS - scores, article reviews, protocol conditions and more https://www.bioz.com/product/neurotrophic+factor+bdnf/Mouse+Brain+Derived+Neurotrophic+Factor+ELISA+Kit/pmc06714227__JCMM___23___6512___s001-3-0-11 Average 91 stars, based on 1 article reviews
elisa kits - by Bioz Stars,
2026-11
91/100 stars
|
Buy from Supplier |
Image Search Results
Journal: Acta neuropathologica communications
Article Title: BDNF augmentation reverses cranial radiation therapy-induced cognitive decline and neurodegenerative consequences.
doi: 10.1186/s40478-024-01906-9
Figure Lengend Snippet: Fig. 2 Riluzole treatment restores hippocampal BDNF in the irradiated hippocampus. 10–12 weeks old WT male mice received cranial radiation therapy (RT) followed by riluzole (RZ) treatment (13 mg/kg) in drinking water for 6–7 weeks. An ELISA-based quantification of BDNF from the micro-dissected hippocampus showed RT-induced reductions in the RT + Vehicle group. Importantly, RZ treatment in the cranially irradiated mice showed significant restoration of BDNF levels. Data are presented as mean ± SEM (N = 6–10 mice per group). P values were derived from two-way ANOVA and Bonferroni’s multiple comparisons test
Article Snippet: BDNF levels were quantified using a commercially available
Techniques: Irradiation, Enzyme-linked Immunosorbent Assay, Derivative Assay
Journal: FEBS letters
Article Title: miR-190a inhibits epithelial-mesenchymal transition of hepatoma cells via targeting the long non-coding RNA treRNA.
doi: 10.1016/j.febslet.2015.11.024
Figure Lengend Snippet: Fig. 3. Suppression of treRNA by miR-190a inhibits EMT in HCC. (A) 20 nM miR-190a, 20 nM siRNA duplexes against treRNA (si-treRNA1 or sitreRNA2), 20 nM miR-190a, or NC RNA was transfected into Huh-7 or HepG2 cells. EMT related genes were quantified 72 h post-transfection as indicated. (B) Cells were treated with antagomiR (anti-miR- 190a) or NC RNA as in (A). The mRNA level of different EMT genes was quantified and normalized to b-actin. (C) Cell lysates were blotting with EMT marker E-cadherin (E-cad), Claudin-1 (Claud), Vimentin (Vimen), N-cadherin (N-cad), SNAI1 (Snail). b-Actin was used as endogenous control. The EMT marker expression level in was calculated using Image J and presented as histogram (right panel). (D) Cells were treated with TGF-b for 12 h and transfected with 20 nM miR-190a, 20 nM siRNA duplexes against treRNA (si-treRNA1 or si-treRNA2) or NC RNA subsequently. The morphological change was captured 24 h after transfection.
Article Snippet: Membranes were blocked by 5% BSA or 5% non-fat milk for 3 h at 25 C and incubated with primary antibody against Ago2 (#2897, Cell Signaling, US), Dicer (#5362, Cell Signaling), E-Cadherin (#3195, Cell Signaling), Claudin-1 (#13255, Cell Signaling), Vimentin (#5741, Cell Signaling), N-Cadherin (#13116, Cell Signaling),
Techniques: Transfection, Marker, Control, Expressing
Journal: Molecular Neurobiology
Article Title: Silibinin Alleviates Cognitive Dysfunction, Biochemical Alterations, and Hippocampal Structural Changes Induced by 5 days of Sleep Deprivation with or Without a Subsequent 24-H Recovery in Rats
doi: 10.1007/s12035-026-06195-y
Figure Lengend Snippet: Effect of silibinin administration on A BDNF (ng/ml) and B CaMKII (ng/mg) in sleep-deprived rats with and without consequent 24-h recovery. Data are represented as mean ± SD ( n = 8); group comparisons were performed using one-way ANOVA, followed by Tukey’s multiple-comparisons test. * P < 0.05, ** P < 0.01, and *** P < 0.001 versus the control group; $ P < 0.05, $$ P < 0.01, and $$$ P < 0.001 versus the SD group; # P < 0.05, ## P < 0.01, and ### P < 0.001 versus the SD + R group. SD: sleep-deprived untreated group; SD + R: sleep-deprived untreated group with recovery; SD + Sil: sleep-deprived group treated with silibinin; SD + Sil + R: sleep-deprived group treated with silibinin followed by recovery. BDNF: brain‑derived neurotrophic factor; CaMKII: calcium/calmodulin‑dependent protein kinase II
Article Snippet: Furthermore, hippocampal tissue homogenates were prepared to determine
Techniques: Control
Journal: bioRxiv
Article Title: Cholesterol recognition motifs in the transmembrane domain of the tyrosine kinase receptor family: the case for TRKB
doi: 10.1101/734012
Figure Lengend Snippet: TRKB and cholesterol interaction. (a,b) Snapshots of the interaction between TRKB and cholesterol at the TMR (see supplement video) indicating that cholesterol interacts with the OH- group (red) in Y433 (blue) in TRKB.TMR (green). (c) The interaction between the TRKB CARC motif and cholesterol happens preferentially at the C-alpha in Y433 residues, as indicated by coarse-grained molecular dynamics simulations. (d) The binding of biotinylated BDNF (bBDNF) and TRKB is modulated by cholesterol in a bell-shaped fashion. Red rectangle area is expanded in (e) for the comparison between BDNF 1ng/ml (black circles) with BDNF 0 (ctrl, open circles). Data expressed as Mean/SEM of (c) cholesterol occupancy; or from binding normalized by (d) chol 0/BDNF10ng/ml or (e) chol 0/BDNF 1ng/ml. ∗p<0.05 from control (BDNF 0 or ctrl, C427).
Article Snippet: The plates were washed 3x with PBS buffer, and a mixture of
Techniques: Binding Assay, Comparison, Control
Journal: Communications biology
Article Title: Astrocytic microdomains from mouse cortex gain molecular control over long-term information storage and memory retention.
doi: 10.1038/s42003-021-02678-x
Figure Lengend Snippet: Fig. 2 subcellular localization of BDNFpro. a Graphical representation of the SIM super-resolution microscope. 3D-SIM image of a GFP-labeled astrocyte in a TBS-slice from control mice. Scale bar: 10 µm. Magnification of a ROI shows BDNFpro/GFP colocalization signal localized in fine membrane extensions of the cell periphery. Scale bar: 200 nm. b 3D-SIM image of the ROI in (a); z-axe is visualized in pseudocolor to facilitate microdomains identification. Scale bar: 200 nm. Magnification of microdomains characterized by the typical fingerlike extension (dashed squares 1 and 2) and flat lamellar sheath (dashed squares 3 and 4) are shown. BDNFpro/GFP colocalization is indicated (red arrowheads). Scale bars: 40 nm.
Article Snippet: In some experiments,
Techniques: Super-Resolution Microscopy, Labeling, Control, Membrane

Journal: Communications biology
Article Title: Astrocytic microdomains from mouse cortex gain molecular control over long-term information storage and memory retention.
doi: 10.1038/s42003-021-02678-x
Figure Lengend Snippet: Fig. 3 localization of BDNFpro in astrocytic microdomains. a Experimental design linking field-potential with electron microscopy (EM) in layer II/III perirhinal cortex. TBS (10 min)-slices were dissected for EM processing. b Representative EM-image depicts BDNFpro-gold particles at axon bouton (dashed squares 1 to 4) and dendritic spine (dashed squares 5 and 6). Scale bar: 100 nm. Magnification indicates representative areas (dashed squares 1 to 6) in which gold particles (red arrowheads) localization is shown. Scale bars: 10 nm. c Representative EM-image depicts BDNFpro-gold particles (dashed squares 1 to 6) at astrocytic microdomains (light blue) Scale bar: 250 nm. Magnification indicates representative areas (dashed squares 1 to 6) in which gold particles (red arrowheads) localization is shown. Scale bars: 20 nm. d Dot plot depicts the number of BDNFpro-gold particles in whole astrocytes and peri-synaptic astrocytes counted per section (n = 41 sections, 5 slices, 3 mice). e Dot plot depicts the percentage of BDNFpro-gold particles at peri-synaptic astrocytes (n = 41 sections, 5 slices, 3 mice). Data are mean ± SEM.
Article Snippet: In some experiments,
Techniques: Electron Microscopy

Journal: Communications biology
Article Title: Astrocytic microdomains from mouse cortex gain molecular control over long-term information storage and memory retention.
doi: 10.1038/s42003-021-02678-x
Figure Lengend Snippet: Fig. 4 vesicular localization of BDNFpro. a z-stack reconstruction shows astrocytes labeled by GFP. Cortical slices from control mice injected with AAV- GFAP-GFP virus were fixed 10 min after TBS and processed for immunostaining and confocal analysis. Scale bar: 10 µm. Magnification of a ROI shows one GFP-astrocyte delimited by an approximate territory (white dashed). Scale bar: 10 µm. BDNFpro/GFP and Vamp2/GFP co-localizations signals are shown. Magnification shows representative areas (dashed squares 1 to 4) in which BDNFpro/GFP and Vamp2/GFP signals overlap. Scale bars: 1 µm. b 3D-SIM image of a GFP-labeled astrocyte in a TBS-slice from control mice. Scale bar: 10 µm. Magnification of a ROI shows BDNFpro/Vamp2 colocalization signal. Scale bar: 500 nm. Magnification shows BDNFpro/Vamp2 colocalization signal in fine membrane extensions of the cell periphery (dashed squares 1 to 4). Scale bars: 50 nm. c EM image depicts BDNFpro-gold at astrocytic microdomains (light blue) surrounding an axon bouton. Scale bar: 100 nm. Magnification of the ROI shows gold particles (red arrowheads) in vesicular-like structures. Scale bar: 20 nm. d Digital reconstruction of the image in (c). Astrocytic vesicles (black boundary) are shown.
Article Snippet: In some experiments,
Techniques: Labeling, Control, Injection, Virus, Immunostaining, Confocal, Analysis, Membrane

Journal: Communications biology
Article Title: Astrocytic microdomains from mouse cortex gain molecular control over long-term information storage and memory retention.
doi: 10.1038/s42003-021-02678-x
Figure Lengend Snippet: Fig. 6 post-synaptic targeting of TrkB/SorCS2 complex. a Schematic representation of the experimental design. Circular DNA probes (−) and (+) are coupled to II° antibody targeting αSorCS2 and αTrkB I° antibody. BDNFpro induces TrkB/SorCS2 complex formation (PLATrkB/SorCS2) that is prevented in the presence of αSorCS2 (blocking) antibody. b Panels show PLATrkB/SorCS2 signals in primary culture of cortical neurons treated with vehicle or BDNFpro. The insets show reference GFP-neurons. Scale bars: 5 μm. c Panels show a GFP-neuron treated with BDNFpro. Scale bar: 5 μm. Magnification of regions of interest 1 and 2 shows dendritic PLATrkB/SorCS2 localization (red arrowheads). Scale bar: 1 μm. d Quantification of PLATrkB/SorCS2 signal in cultured neurons treated with vehicle, BDNFpro (in presence or absence of αSorCS2), mBDNF or proBDNFCR. Data are presented as mean ± SEM; **p < 0.01 (unpaired t- test) (n = 111 cells, 3 cultures for vehicle; n = 152 cells, 4 cultures for BDNFpro; n = 98 cells, 3 cultures for BDNFpro/aSorCS2; n = 89 cells, 3 cultures for mBDNF; n = 79 cells, 3 cultures for proBDNFCR). e z-stack reconstruction showing NeuN, PSD95 and PLATrkB/SorCS2 signals in baseline and TBS slices. NeuN/PLATrkB/SorCS2 and PSD95/PLATrkB/SorCS2 colocalization signals are shown. Scale bars: 40 μm. NeuN/PLATrkB/SorCS2 and PSD95/PLATrkB/SorCS2
Article Snippet: In some experiments,
Techniques: Blocking Assay, Cell Culture, Immunofluorescence

Journal: Communications biology
Article Title: Astrocytic microdomains from mouse cortex gain molecular control over long-term information storage and memory retention.
doi: 10.1038/s42003-021-02678-x
Figure Lengend Snippet: Fig. 7 BDNFpro-induced TrkB/SorCS2 targeting. a Schematic representation of the experimental design. Step I, deletion of p75NTR in astrocytes from tamoxifen-treated p75-flox mice precludes proBDNF transfer from neurons to astrocyte following TBS. Step II, LV-BDNFprostop transduction replaces BDNFpro in astrocytes. Step III, astrocytic BDNFpro provides final increase of TrkB/SorCS2 complexes in dendritic spines and LTP maintenance. b z-stack reconstruction showing NeuN/PLATrkB/SorCS2 colocalization signal in TBS-slices from p75-flox mice transduced with LV-GFPstop or LV-BDNFprostop. Scale bars: 40 μm. The insets show the field of analysis. Scale bars: 15 μm. NeuN/PLATrkB/SorCS2 colocalization was quantified using Mander’s overlap. **p < 0.01 (unpaired t-test) (n = 4 slices, 3 mice for each experimental condition). c Dot plot shows quantification of pTrkB/TrkB colocalization in baseline- and TBS- slices from p75-flox mice transduced with LV-GFPstop or LV-BDNFprostop and control littermates using Mander’s overlap. ***p < 0.001 (unpaired t-test) (n = 4 slices, 3 mice for p75-flox mice/LV-GFPstop/TBS; n = 4 slices, 3 mice for p75-flox mice/LV-GFPstop/baseline; n = 6 slices, 4 mice for p75-flox mice/ LV-BDNFprostop/TBS; n = 5 slices, 4 mice for p75-flox mice/LV-BDNFprostop/baseline; n = 5 slices, 3 mice for control littermates/TBS; n = 6 slices, 3 mice for control littermates/baseline). Data are normalized to baseline and presented as mean ± SEM.
Article Snippet: In some experiments,
Techniques: Transduction, Analysis, Control
Journal: Developmental Cell
Article Title: Axonal endoplasmic reticulum tubules control local translation via P180/RRBP1-mediated ribosome interactions
doi: 10.1016/j.devcel.2024.05.005
Figure Lengend Snippet:
Article Snippet: recombinant human BDNF protein ,
Techniques: Recombinant